Installing Apache JMeter in Windows XP

This article contains following topics:


  • Prerequisites for installing Apache JMeter
  • How to install Apache JMeter?
  • How to start Apache JMeter?

Prerequisites for installing Apache JMeter


Apache JMeter is a utility based on Java.  We need Java runtime already installed to use Apache JMeter.  After confirming that our Windows XP system has proper Java runtime installed we can proceed for installing Apache JMeter.

For checking whether we have Java runtime installed we can follow one of the methods given here.  The second method given on that page is the easiest and that is opening a command prompt and typing the command:

java -version

If the command works Java is installed and you will also know the version of Java.

Apache JMeter runs on a fully compliant JVM 1.4 or higher. (It is found that some early versions of Java 1.5 below update 7 do not recognize some JVM switches and hence the jmeter.bat script file needs some changes to run JMeter, described at the end of post).

Steps for installing Apache JMeter

The Apache JMeter Home page contains links for downloads.  When we visit Apache JMeter home page the Apache Jakarta project symbol of a bird feather can be seen with introduction to JMeter.


As shown in the image below we have to select the Download Releases link from the home page.


The download page presents many options for download.  Usually the suggested mirror is the best mirror but we can choose another one if the suggested mirror gives error or seems slow.  For just using the tool we need only the binary release.  The screen below shows the version current at the time of writing this article.  The TGZ version of the binary is relatively smallest in size.  Click on that link and save the download when prompted by the browser.

Alternatively you can click on the ZIP version given below and use any standard UNZIP utility to extract the files.


I have saved the TGZ file and extracted the contents by using 7Zip utility for windows.  After extracting the TGZ file we get a folder named jakarta-jmeter-n.n.n, where n.n.n is the version number which we downloaded.

The executable script for Apache JMeter is located in the bin directory.


The screen below shows all the contents of the jmeter bin folder.

Starting Apache JMeter tool


The executable script for Windows platform is jmeter.bat for Linux systems it will be jmeter.sh
These scripts are used to start JMeter in GUI mode.  Let us double click the jmeter.bat script to start the tool.


Double clicking the jmeter.bat file will start one command prompt and the JMeter utility in GUI mode, as shown below.  The command prompt is tied with the GUI and hence cannot be closed.  If the command prompt is closed the GUI will terminate.  We can keep the command prompt minimized while working with JMeter GUI.  The command prompt is useful in viewing any JMeter exceptions that may occur.


We saw how to download, install and start the Apache JMeter utility.

NOTE: Although Apache JMeter can run on any fully compliant Java version above Java 1.4 (It is found that some early versions of Java 1.5 below update 7 do not recognize some JVM switches and hence the jmeter.bat script file needs some changes to run JMeter.  If you happen to have early Java 1.5 version below update 7 then you may get error when double clicking the jmeter.bat file.  The error can be fixed by commenting line "set DUMP=-XX:+HeapDumpOnOutOfMemoryError" in the jmeter.bat file.  Open the jmeter.bat file by right clicking and choosing Edit option.  add REM before that line and you are ready to go.

Reference:
1) http://jakarta.apache.org/jmeter/usermanual/get-started.html#install

Short Interview with Apache JMeter

Quality Analyst: Hello JMeter can you tell us something about yourself?

Apache JMeter: Hello!  I am a load testing tool.  If you tell me how to perform a certain action I can simulate multiple users doing that action.  This is like cloning users, isn't it?  I am a child of Apache Jakarta project, technically sub project of Apache Jakarta project.  I was created initially to test performance of web sites, but you know what, now I help people test many more things like database performance, FTP server performance and much more. For more information you can visit my home page here.

Quality Analyst: We heard that sometimes you talk Java and Javascript language?  Is this true, and do we Quality Analysts have to know Java or JavaScript to talk with you?
Apache JMeter: Well, simple scenerios of testing can be done with no knowledge of JavaScript but for advanced functional testing you should know JavaScript.  Java is needed only if you are using Java Sampler part of my abilities and if you want to extend my capabilities.

Quality Analyst: You mentioned functional testing just now, so can you also help us testing our software functionally?
Apache JMeter: The answer is yes.  I can help you test the software functionally.  This requires thorough knowledge of the Sampler you are using.  For example in case of web site testing HTTP Request Sampler is used so the request and response patterns of this sampler shall be known to the user.  They can then write assertions on the response to check whether the response was as expected and hence functionally check the response.

Quality Analyst: Do you like a particular browser?
Apache JMeter: This question is confusing.  Let me clear some points first.  I am not a browser.  No, I am not a browser in traditional sense.  Yes I can visit a web site just like a browser do (through my HTTP Request Sampler and HttpClient Sampler) but I do not show that web site on screen exactly as a browser do.  My job is to visit a web site and capture the response sent by that web site.  I can show you the response as TEXT, XML or even in terms of HTML but without executing any JavaScript on that page.

So there is no question of me liking any browser. Browsers and I are different things.  My behaviour is different than any existing browser.

Quality Analyst: I know that you help us record our actions and then you can play them again.  My question is, are those recordings OS dependant?  In other words if I record something on Linux, can I play those actions on a Windows workstation?
Apache JMeter: Oh yes you can.  I can save Test Plans for you and those test plans are in XML format so they have nothing to do with any particular OS.  You can run those test plans on any OS where I can run.

How Apache JMeter simulates multiple users?

Topics covered in this article:


  1. Introduction to different elements of a JMeter Test Plan.
  2. Difference between real world and JMeter world while doing a web request.
  3. Workflow of a typical web server request and response.
  4. JMeter's role in a web testing work flow.
Let us take a view at how a request for web page is sent to the Web server from a User's browser, and how a web page is finally displayed.  Understanding this workflow will give us opportunity to imagine how JMeter fits in this workflow and how it can do same thing as a browser does.


Now introducing Apache JMeter into the picture.  The actions taken by the User are no longer required.  The User action trigger some HTTP requests which are recorded in a JMeter HTTP Request Sampler for multiple uses.  

See how JMetr replaces a browser, but how the working is a little different.


So what makes one User transaction in terms of JMeter?  

When we add a HTTP Request Sampler in JMeter Test plan it stores one Web Page calling and receiving sequence.  We can call this as a single user transaction.  As soon as we tell this to JMeter it is capable of doing the same thing any number of times.  It also does this multiple times simultaneously.


As JMeter is not exactly a browser the HTTP Request Sampler makes all the received data available for further analysis.  We use View Tree Listener for actually visualizing the received response.  View Tree Listener is a good way to know what request was sent, what was the response and the result of the transaction.


When JMeter simulates multiple users by making the same call multiple times, in different operating system threads (we can say execution paths) that time more analytical data is available.  The Summary Report Listener can show us the additional calculated data line Minimum time and Maximum time taken to receive the response.  It also calculates the average time taken using all the results together.


So we have seen that for web site testing we need many items like
  1. HTTP Request Sampler
  2. View Tree Listener
  3. Summary Report Listener
To use these items provided by JMeter we will also need items like

  1. Test Plan and
  2. Thread Group
For some advanced user transactions and logical conditions there are Controllers.  Once we learn how to combine these elements we are ready to write our first Test Plan in JMeter.

Yes initially this may seem like a lot of jargon.  Eventually we will get used to these elements and then testing will be a piece of cake.  Ok, let us re-visit what they all mean in JMeter world.


We will write our first Test Plan step by step in the next article but let us first get introduced formally with the different elements we have seen till now.

Now we know some elements which will be used in creation of a Test Plan in JMeter.  It will be worthwhile checking the difference between real world transactions and the transactions that happen in JMeter world.  Is there one to one mapping between actions performed in real world and while executing a JMeter test plan?

Testing performance of web page with Apache JMeter


So this is what we shall see when we are done with creating the Test Plan.  We have to start with a blank JMeter window

Before adding anything more to this window let us change the name of Test Plan.  We can type a new name for the node in the Name text box.  In this version of JMeter the name does not get reflected immediately when you type it in the text box.  You have to change focus to workbench node and back to Test Plan node to see the name getting reflected.

Let us give new name "First Test" to the Test Plan node.

Now we will add our first element in the window.  We will add one Thread Group, which is placeholder for all other elements like Samplers, Controllers, Listeners.  We need one so we can configure number of users to simulate.  The Thread Group represents one set of actions performed by User.

In JMeter all the node elements are added by using the context menu.  You have to right click the element where you want to add a child element node.  Then choose the appropriate option to add.

We will click the Thread Group option and it will get added under the Test Plan (First test) node.

Like we changed the name of Test Plan let us also change the name of Thread Group.  For us this is the element which represents multiple users.  So let us name it "Users".  For us this element means Users visiting the Google Home Page.

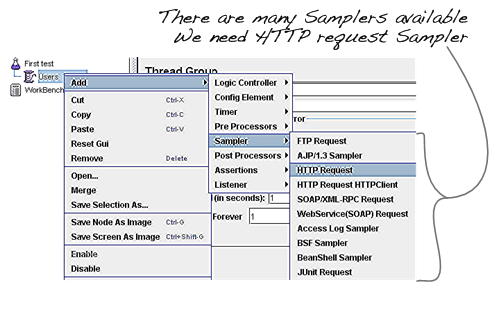
Now we have to add one Sampler in our Thread Group (Users).  As done earlier for adding Thread group, this time we will open the context menu of the Thread Group (Users) node by right clicking and we will add HTTP Request Sampler by choosing Add > Sampler > HTTP request option.

This will add one empty HTTP Request Sampler under the Thread Group (Users) node.

 We will need most configuration in this node element, HTTP Request Sampler.  The settings we have to configure are:
  1. Name: we will change the name to reflect the action what we want to achieve
    1. This will will name "Visit Google Home Page"
  2. Server Name or IP: here we have to type the web server name
    1. In out case it is www.google.com
    2. Note http:// part is not written this is only the name of the server or its IP
  3. Protocol: we will keep this blank
    1. That will mean we want HTTP as the protocol
  4. Path: we will type path as / (slash)
    1. This means we want the root page of the server
    2. This also means now the server will decide what page will be sent to us and it is the default page of the web site
After add the HTTP Request Sampler we will need one Listener.  Let us add View Results Tree Listener under the Thread Group (User) node.  This will ensure that the results of the Sampler will be available to view in this Listener node element.

Adding a listener is also same like adding a new node under Thread Group.  Open the context menu and choose Add > Listener > View Results Tree option to add the listener.

With this much of setup we are now ready to run our first test.  Coming back to the configuration of the Thread Group (Users) we have kept it all default values.  This means JMeter will execute the sampler only once.  It will be like a single user and only one time.

This is similar to like a user visiting a web page through browser, only here we are doing that through JMeter sampler.  We will execute the test plan using Run > Start option.

Apache JMeter asks us to save the test plan in a disk file before actually starting the test.  This is important if we want to run the test plan again and again.  If we say not to save by clicking No option it will run without saving.  Let us save it first so we can reuse it again.


We have kept the setting of the thread group as single thread (that means one user only) and loop for 1 time (that means run only one time), hence we will get result of one single transaction in the View Result Tree Listener.

This means JMeter was successful in fetching the web page at the given URL just like a browser.  It has stored all the headers and the response sent by the web server and ready to show us the result in many ways.

Let us take a closer look at the three tabs available in the View Result Tree Listener view.

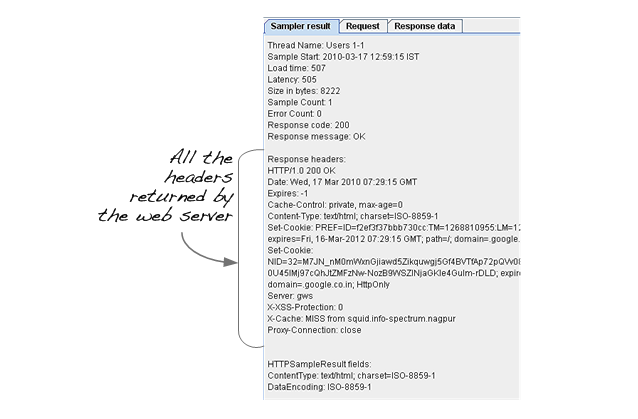
The first tab is Sampler Results.  It shows JMeter data as well as data returned by the web server.  Usually browsers hide this data from us as it is not related to showing the web page.  This data is utilized internally by the browser, for example when there is a Response Code: 404 then the browser shows a page not found error page, and when the Response Code is 200 the browser shows the received web page HTML.

The second tab is Request, where all the data which was sent to the web server as part of the request is shown.

The last tab is Response data.  In this tab the listener shows the data received from server as it is in text format.  It also have facility to show the data in XML, HTML formats but that will be just the data in other way (no JavaScript will be executed).  This may look different that the page actually seen in the browser.


We can select different ways of viewing this response data like as below:
This was just one request but JMeter's real strength is in sending the same request like many users are sending it.  To test the web servers with multiple users we will have to change the Thread Group (Users) settings.

We will set 50 users and these requests will be sent with some delay of (10/50) seconds as we have set the ramp up time to 10.

To visualize the results, a better aggregating listener will be required so we will add Summary Report Listener in the Thread Group node.  Adding Summary Report Listener is similar to adding a View Results Tree Listener.  Just right click on the Thread group node and choose Add > Listener > Summary Report.

We will run the test plan again after adding the Summary Report Listener ans when the test is done we will see the following results.  Your results may be different than mine due to different environments but mostly similar.

This is how we tried testing one single page with JMeter.  The summary report shows values about the measurement JMeter has done while calling the same page as if many users are calling the page.  Let us look at some of the value headings and what they mean:

  • Samples: A sample mean one sampler call.  One request to web page in our case.  So the value of 51 means total 51 web page requests to the page http://www.google.com were made by JMeter 
  • Average: This value is the average time taken to receive the web pages.  In our case there were 51  values of receiving time which were added and divided by 51 and this value is arrived by JMeter.  This value is a measure of performance of this web page.  This means on an average 334 milliseconds time is required to receive this web page for our network conditions.
  • Min and Max: These are the minimum and maximum value of time required for receiving the web page.
  • Std. Dev:  This shows how many exceptional cases were found which were deviating from the average value of the receiving time.   The lesser this value more consistent the time pattern is assumed.
  • Error %: This value indicated the percentage of error.  In our case 51 calls were made and all are received successfully this means 0 error.  If there are any calls not received properly they are counted as errors and the percentage of error occurrence against the actual calls made is displayed in this value.
To check the performance of the web page the average value of receiving the page is an important parameter to check.
The sample test plan so created in this article is available for download here:

NOTE: This technique of manually adding a HTTP Request Sampler is only useful in testing a single web page.  This means when we visit the home page of any web site this technique works best.  When we want to test a sequence of web pages, and when there involve web sites created by complex frameworks like ASP.NET, Java JSF etc then recording the sequence of web pages using HTTP Proxy component is useful.  The recording of web pages sequence with HTTP Proxy component will be covered in a post very soon on this blog.

First Impression About Apache JMeter

When quality analyst gets introduced to Apache JMeter they have to struggle on many grounds. If they are used to work with commercial tools like Quick Test Pro or TestRunner then the shifting of paradigm is difficult.


These are some initial impressions of quality analysts about Apache JMeter:

  1. Technical jargon like test plan, Thread, workbench, controller etc is not user friendly.
  2. How to create test plan? What is thread, workbench? There are so many options in Controller.
  3. When compared with any other automation tool, it seems difficult. Like In QTP, Novice user can simple install QTP, Record and then run and view directly where its testing is failed. But in JMeter we cannot directly record and run. We need to first create Test Plan, add http request and then to view result we need to add listener. In short first we need to understand Jargon.
  4. It seems JMeter is more of developer's tool than QA's tool. For doing functionality testing, we need write coding. Jar files, class etc.
  5. Analysis of the test result is difficult.
  6. Errors of JMeter are not directly displayed. It is difficult to understand where it is failed.
  7. Precise and well defined help is not available.
  8. Invoking JMeter is from /bin folder is not user friendly. Also command prompt opening with it.
  9. Since JMeter is open source tool, we really cannot find the scope of its usage.
  10. How to measure how CPU, Memory, peak memory when doing performance testing?
  11. Viewing result in different formats e.g XML, requires updates in XML files which user is not aware
  12. Tool support different testing like distribution, testing across different bandwidth but for this requires lot of changes in configuration file and it is not mentioned properly in Help file.

How to record HTTPS requests by JMeter's recording proxy

If you ever tried to record HTTPS requests by the recording proxy of the lastest stable version of JMeter (2.3.4) you know that it's impossible. And HTTPS spoofing option can not help in the most cases.


I investigated this problem and found interesting thing. There is already a bug 47622 in JMeter's Bugzilla that already has RESOLVED FIXED status. Some guys added a patch and fake SSL certificate to JMeter so it allows to record HTTPS requests now. But you must use developer (nightly) build instead of stable release until this bugfix is added to next stable release.

Basic web test plan structure

The best practice is to group logically related HTTP requests to transactions using Transaction controllers. As the result you will get not only response time values of HTTP requests but response time values of the whole transactions too.


Thread group
    Transaction controller 1
        HTTP Request 1
        HTTP Request 2
        ...
        HTTP Request N
    Transaction controller 2
        HTTP Request 1
        HTTP Request 2
        ...
        HTTP Request N
    ...
    Transaction controller N
        HTTP Request 1
        HTTP Request 2
        ...
        HTTP Request N

Pauses in test plan

For complete user simulation you need to add pause after each transaction. In most cases you will use only two types of pauses:


  1. Add constant pause to test planConstant pause. Just add Test Action controller after the Transaction controller. Specify the pause duration in ms and be sure that "Pause" item of "Action" option is checked.

    Constant pause options
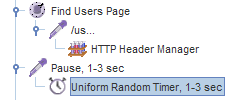
  2. Add variable pause to test planVariable pause. Add Test Action as described above but specify the pause duration as 0 (zero). Then add Uniform Random Timer as a child of Test Action and specify the minimum value and maximum offset value.


Using JMeter properties

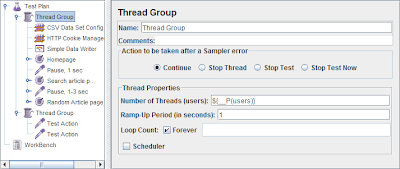
Sometimes I need to modify some parameters in the Test Plan and it requires me to start JMeter, open the Test Plan file and edit these parameters there. But it's better to use JMeter properties for this task. Look at the image below.


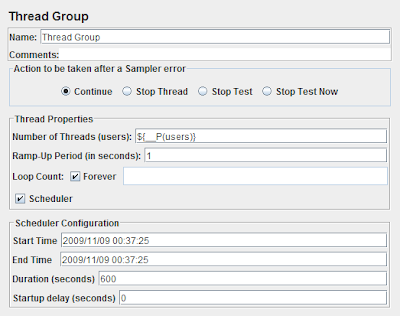
There are JMeter properties used as values of "Number of Threads (users)" and "Loop Count" options: ${__P(users)} and ${__P(count)}. Also we must add two parameters to JMeter command line:

jmeter -t TestPlan.jmx -Jusers=10 -Jcount=50

Now you can specify necessary parameters on the fly. I recommend you to use properties for the following options: number of users, loop count, host, port, results and data filenames, etc.

How to run a test plan for a certain amount of time

If you want to run your Test Plan for a certain amount of time instead of a certain amount of iterations you can do it in two ways:

  • by specifiing testing duration on the Thread Group GUI (Scheduler checkbox must be checked). Note that you must specify the value of Startup delay option as zero otherwise you will need to specify Start Time option value before each test running. And of course you need to check Forever checkbox of Loop Count option. There is 10 minutes test example on the screenshot below.

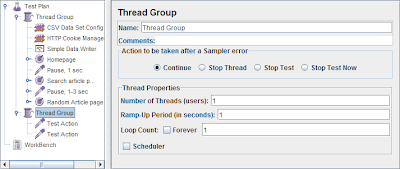
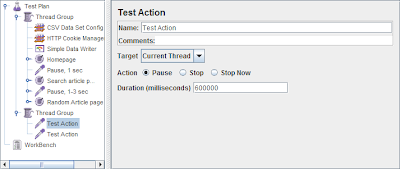
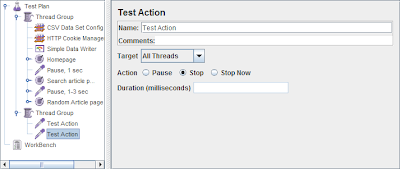
  • by creating extra Thread Group with two Test Action samplers. The first Test Action configured as pause, and the seconf one is configured to stop all treads. Look at the screenshots below for 10 minutes test example.


How to do the Test Plan more flexible using variables and properties

JMeter's variables and properties can do your Test Plan very flexible and prevent you from frequent modifications of the Test Plan. Just add the most frequently used options as variables on the Test Plan page and specify their values using "__P" function as on the screenshot below.


As you can see Test Plan can be executed with default values and at the same time if you need to modify some options you can pass them to Test Plan through the command line without the modification of the Test Plan.

How to add cookie support to your Test Plan

If you want JMeter to handle cookies automatically you need to add HTTP Cookie Manager to Thread Group.

Be sure that Cookie Policy option is set to "compatibility" value, it will work in most cases. As for "Clear cookies each iteration?" checkbox I always check it and never had the situation when I was need it to be unchecked.