Top 23 JMeter Interview questions

1) Explain what is JMeter?
JMeter is a JAVA tool, which is used for performance load testing.
2) Explain how JMeter works?
JMeter acts like a group of users sending requests to a target server. It collects response from target server and other statistics which show the performance of the application or server via graphs or tables.
3) Explain where you can use functions and variables?
Variables and functions can be written into any field of any test component
4) Mention what are regular expressions in JMeter?
Based on the pattern, regular expression are used to search and manipulate text. JMeter is useful in interpreting forms of regular expression or patterns being used throughout a JMeter test plan.
5) Explain what is Samplers and Thread groups?
  • Thread group: For any test plan, JMeter is the beginning part of thread group elements. It is an important element of JMeter, where you can set number of users and time to load all the users given in the thread group
  • Samplers: Sampler generates one or more sample results; these sample results have many attributes like elapsed time, data size, etc. Samplers allow JMeter to send specific types of requests to the server, through samplers, thread group decides which type of request it need to make. Some of the useful samplers are HTTP request, FTP request, JDBC request and so on.JMeter
6) Whether the test plans built using JMeter are OS dependent?
Usually, test plan are saved in their XML format, so there is nothing to do with any particular O.S. It can be run on any OS where JMeter can run.
7) Mention what are the types of processor in JMeter?
The types of processor in JMeter are
  • Pre-processor
  • Post processor
8) Explain what are Pre-processor Elements? List some of the pre-processor elements?
A pre-processor is something that will happen before sampler executes. To configure the sample request prior to its execution or to update variables that are not extracted from response text pre-processor elements are used.
Some of the pre-processor elements are
  • HTTP URL re-writing modifier
  • HTTP user parameter modifier
  • HTML link parser
  • BeanShell PreProcessor
9) Mention the execution order of Test Elements?
The test plans elements execution order is
  • Configuration elements
  • Pre-processors
  • Timers
  • Samplers
  • Post-processors
  • Assertions
  • Listeners
10) What does “contain” and “matches” indicates in the regular expression?
In the regular expression, contains indicates that the regular expression matched at least some part of the target. While matches means the regular expression matched the whole target. So, ‘alphabet’ is “matched” by ‘al.*t.’
11) Explain what is configuration elements?
A configuration element works parallel with a Sampler. To set up defaults and variables for later use by samplers configuration elements can be used. At the start of the scope, these elements are processed before any samplers in the same scope.
12) Explain what is a timer in JMeter and what are the types of it?
A JMeter thread by default will send requests continuously without any pause. To get a pause between the request, Timers are used. Some of the Timers used are Constant Timer, Gaussian Random Timer, Synchronizing Timer, Uniform Random Timer and so on.
13) Explain what is Test Fragment?
Test fragment is also a type of element like Thread Group element. The only difference is test fragment is not implemented unless it is referenced by either a Module controller or an Include controller.
14) Explain what is Assertion in JMeter? What are the types of assertion?
Assertion helps to verify that your server under test returns the expected results
Some commonly used Assertion in JMeter are
  • Response Assertion
  • Duration Assertion
  • Size Assertion
  • XML Assertion
  • HTML Assertion
15) Explain how you can reduce the resource requirement in JMeter?
To reduce the resource requirements in JMeter
  • Use non-GUI mode: jmeter –n –t test.jmx –l test.jtl
  • During the load, test doesn’t use “view results tree” or “view results in table” listeners, use them only during scripting phase
  • Don’t use functional mode
  • Instead of using lots of similar samplers, use the same sampler in loop and use variable to vary the sample
16) Explain how you can perform spike testing in JMeter?
By synchronizing, timer JMeter spike testing can be achieved. Synchronizing timer, blocks thread until a specific amount of threads has been blocked and then release them all together thus creating large instantaneous load.
17) Explain how you can capture the script of the authentication window in JMeter?
Normally, you can capture script by recording.
  • First you have to Threadgroup in Testplan and then make HTTPProxyServer in Workbench
  • After that, set port number in Global Setting box (e.g., 8911) and modify your connection setting in IE as local host in address 8911 as in port
    Then you can start http proxy server in JMeter and run your application for login
18) List out few JMeter Listeners?
Some of the JMeter Listeners are
  • Spline Visualizer
  • Aggregate Report
  • View Result Tree
  • View Result in Table
  • Monitor Results
  • Distribution Graph
  • BeanShell Listener
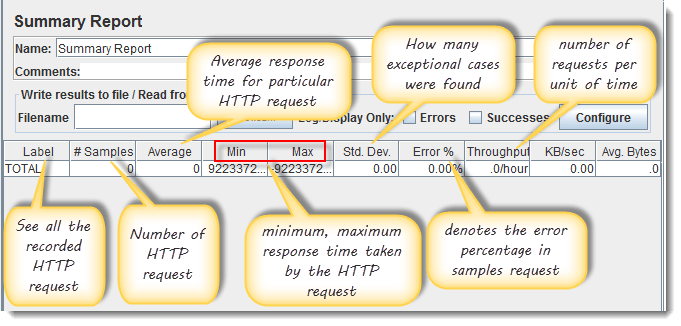
  • Summary Report and so on
19) What is distributed load testing? How it can be achieved?
Distributed load testing is the process through which numerous systems can be used for simulating load of a large number of users. By using the master-slave configuration, JMeter can do distribute load testing.
20) In JMeter is it necessary to call embedded resources explicitly?
You can eliminate all embedded resources from being explicitly called. Requests have a checkbox at the bottom that says “retrieve embedded resources.” It would grab all CSS, JPG, etc. It is a brilliant way to find resources and broken link in a web App.
21) Explain what is the role of Timer in JMeter?
With the help of timer, JMeter can delay the time between each request, which a thread makes. It can solve the overload problem of the server.
22) Explain what is Post-processor?
To perform any action after making a request, Post- processor is used. For example, if JMeter sends an http request to the web server, and if you want JMeter to stop sending the request if the web server shows an error, then you will use post-processor to perform this action.
23) What are the benefits that JMeter offers for performance testing?
JMeter offers benefits on performance testing like
  • It can be used to test performance for both, static resources as well as dynamic resources
  • It can handle a maximum number of concurrent users then your website can handle
  • It provides the graphical analyses of performance reports

HTTP Proxy Server Testing using Jmeter

Record Testing help tester to record & run their activity against test target. It is a type of automated testing but for multiple users. This chapter guides you how to use Proxy Server to record your test.
The Proxy Server allows JMeter to watch and record user activity while they are browsing web application with normal browser.
Here is the roadmap of this practical example

Step 1) Setting HTTP Proxy server

This is Step-by-step guide to setup proxy
  1. Start JMeter
  2. Select Test Plan on the tree
  3. Add Thread Group
    Right click on the Test Plan and add a new thread group: Add → Threads (Users) →Thread Group
  1. Add HTTP Request
    Select the Thread Group; right click Add → Config Element → HTTP Request Defaults
In new HTTP Request Defaults element: In Server name or IP, enter "google.com". You should keep the others fields blank  
  1. Add Recording Controller
    Right click on the "Thread Group" and add a recording controller: Add → Logic Controller →
    Recording Controller
  1. Add Proxy Server to WorkBench
    Right click on the Workbench and add the http proxy: Add → Non-Test Elements → HTTP Proxy Server  
  2. Set Target Controller where your recorded scripts will be added
  
  1. Start Proxy Server
    Return to HTTP Proxy Server, and click the Start button at the bottom. Now your JMeter proxy server start
      
  2. Start your Browser (I used Firefox), choose Tool → Option → Advanced → Network → Setting → Enter HTTP proxy as figure below
     

Step 2) Record your activity

  1. Now Launch http://www.google.com in your web browser (JMeter still open)
  2. Do activities search the keyword "guru99".
  3. Back to JMeter, in HTTP Proxy Server, click Stop when finished
     
      
  4. After finishing recording, you will see JMeter automatically created a new HTTP request as figure below
    JMeter has already recorded a user request to Home Page of Google website. Http://www.google.com/
    The other HTTP requests display in above figure, you should remove them. Because, sometime JMeter also records some advertising links while you are searching keyword on Google. We should ignore them in our Test Plan
  5. Click File → Save your Test Plan as
  6. A Dialog box display → enter a name of your test plan at File Name field → Click Save
    Now your Test Plan is saved under name RecordingTestPlan.jmx

Step 3) Run your Test Plan

  1. Select Thread Group → Add → Listener→ Summary Report

  1. The Summary Report will show some basic statics
  2. Select Thread Group, enter information as figure below
You can refer the article 5 JMeter Performance Testing.doc to know the detail about Thread Group configuring  
  1. Before you start the test, select "Summary Report". When you ready to run test, select Run → Start (Ctrl+R). JMeter will playback your activity in 100 times
    As the test runs, the statistics will change until the test is done.

Step 4) Save your test result

  1. Click Save Table Data to save test result to file
  1. Enter the name of test result and click Save. Test Result in JMeter is saved in *.csv format as default
Troubleshooting
If you face the issue while running the above scenario … do the following
  1. Check whether you are connecting to internet via a proxy. If yes, remove the proxy.
  2. Open a new instance of Jmeter
  3. Open the RecordingTestPlan.jmx in Jmeter
  4. Right Click on Workbench → Merge→ Select HTTP Proxy Server.jmx
  5. Click on Thread Group → Summary Report
  6. Run the Test

Best Practices for your Jmeter Tests

Guidelines to overcome limitations of JMeter in distributed environment:
  1. Limit the Number of Threads
  2. Using a proxy server
  3. Using variables
  4. Reduce resource requirement
  5. Check the JMeter logs
  6. Erase the local path from CSV Data Set Config
  7. Follow file naming convention
JMeter has some limitations especially when it is run in a distributed environment. To use JMeter efficiently for testing, you should use following guidelines:

Limit the Number of Threads

The maximum number of threads you can effectively run with JMeter is 300. This limit is because of hardware's capabilities. If JMeter is made to run with more number of threads, the accuracy of timing information will decrease.

Using a proxy server

The Proxy server helps you to abstract out certain common elements from the recorded samples. Moreover, it is useful features to record your testing.

Using variables

Some test plans need to use different values for different users/threads. For example, you might want to test   a sequence that requires a unique login for each user. This is easy to achieve using variables.

Reduce resource requirement

The GUI mode consumes a lot of computer memory under heavy load. It causes performance issues.
There're some tips to reduce resource requirement:
  • Use non-GUI mode
  • Disable the "View Result Tree" listener during the Load test. Because it consumes more memory and causes JMeter running to run out of memory.
  • Disable all JMeter graphs results
  • Use CSV test result format.
  • Only save the needed test result. JMeter could take a long time to save very detailed test results.

Check the JMeter logs

Any errors in the test plan or test execution will be recorded in the log files. Monitoring the log file help you   to find the error early

Erase the local path from CSV Data Set Config

If you are using an existing CSV data file that you created on your local computer, you should delete the existing local path (Current path of CSV file). If you don't delete the local path, JMeter cannot find the CSV data file on your local PC.

Follow file naming convention

Don't save test plan under complex file name, use only alphanumeric characters.

How to perform Distributed Testing in JMeter

Overview

Distributed testing is a kind of testing which use multiple systems to perform stress testing. Distributed testing is applied for testing web sites and server applications when they are working with multiple clients simultaneously.
Distributes testing uses client-server model as figure below:
  • Master: the system running JMeter GUI, control each slave.
  • Slave: the system running jmeter-server, receive command from the master and send a request to server under test.
  • Target: the web server under test, get request from slaves.

Start your test

Precondition:
  • The firewalls on the systems are turned off. In some cases, the firewall may still be blocking the traffic. You should disable the Window firewall or Linux firewall.
  • All the machines should be on same subnet. If machines are not on same subnet, maybe they will not recognize each other in the network.
  • Use the same version of JMeter to avoid unanticipated errors/issues.
Here is the roadmap of this testing:

Step 1) System configuration

On the slave systems, go to jmeter/bin directory and execute file "jmeter-server.bat".
Assume that a slave machine has IP address: 192.168.0.10. On windows, you should see a window appear like following figure:
On the master systems, go to /bin directory and edit file jmeter.properites, add IP slave machine as below

Step 2) Run the test

On the master machine, run JMeter GUI and open the test plan.
Click Run on the menu bar; select Remote start -> select the IP address of slave machine

Step 3) Troubleshooting

If you are unable to run test form the above machine and see below error, simply ask owner of slave machine to run the jmeter-server.bat File.

Limitation:

There are some basic limitations for distributed testing. Here's list of the known items:
  • Server and all clients must be on the same subnet.
  • Distributed testing required target server to have large processing power. The target Server could be easilyoverloaded in case it gets too many requests by distributed JMeter tests.
  • A single JMeter can only handle a limited number of threads (100- 300 threads).
  • The distributed JMeter tests are complex, difficult for beginner to build.

How to use Processor in JMeter

Processor is used to modify the Samplers in their scope.
There are 2 Types of processors:
  1. Pre-processor
  2. Post-processor

Pre-processor:

Pre-processor executes some action before making Sampler Request.
Consider a simple example: let's say you wanted JMeter to "spider" through website under test, parse link(check all links on the page) and return the HTML. You would add some action such as "HTML link parser" to your controller before creating an HTTP request.

Post-processor:

Post-processor executes some action after making a Sampler Request.
Consider a simple example: JMeter send HTTP request to the web server under test (etc www.google.com) and get the response. You want JMeter to stop the testif the server response is error. You can use the post-processor to do above task as following:

Processor-Hands on

This tutorial will show you step-by-step instructions how to use Post-processor in JMeter. Let start with simple test script.
  1.  JMeter sends HTTP request to the web server under test www.google.com.
  2.  JMeter gets response from the Google server.
  3.  If server response is error, JMeter will stop the test.
  4.  If server response OK (no error), JMeter will continue the test.
Here is the roadmap of this example:
Pre-condition:
We re-use the Step 1 and Step 2 in article  JMeter Performance Testing.

Step 1) Add Thread Group

Right click on the Test Plan and add a new thread group: Add -> Threads (Users) -> Thread Group
But in Thread Group control panel, enter Thread Properties as following:
This setting lets JMeter create 10 user request to http://www.google.com  10 times.

Step 2) Add JMeter elements

  • Add HTTP request default
  • Add HTTP request
We still make JMeter send request http://www.google.com to Google server.

Step 3) Add Post-Processor Element

Right Click Thread Group -> Add -> Post Processor -> Result Status Action Handler
Result Status Action Handler allows the user to stop the thread or the whole test if the user request failed.
In Result Status Action Handle Pane, choose Stop Test Now. This selection will stop the test if JMeter get the error from server response.

Step 4) Config the HTTP Request

Open the HTTP Request Panel. Enter "abc" to the Path field.
When you enter "abc" to the path, JMeter will create URL request to Google server:http://www.google.com/abc. This URL doesn't exist on Google server. It is wrong URL request so Google server will return error.

Step 5) Add View Result Tree

Right Click Thread Group  -> Add  -> Listener  -> View Result Tree

Step 6) Run Test

Select View Result Tree, press Run button on Menu bar. You will see the error response from Google server and the test will stop with out completing 100 threads.
Now return to step 4, open the HTTP Request pane, enter "calendar" to the pane. It makes JMeter create URL request http://www.google.com/calendar to the Google server. This is correct URL request so Google server will return OK (no error).
Select View Result Tree, press Run button on Menu bar. You will see the OK response from Google server and the test will continue until all 100 threads are complete.

Troubleshooting:

If you face the issue while running the above scenario ... do the following:
  1. Check whether you are connecting to internet via a proxy. If yes, remove the proxy.
  2. Open a new instance of Jmeter
  3. Open the ProcessorTestPlan.jmx in Jmeter
  4. Double-click on Thread Group -> View Results Tree
  5. Run the Test

How to use Controllers in JMeter

If you want to control "when" to send a user request to a web server under test, what would you do?
JMeter gives us a feature to do that. It's Logic Controllers.

Logic Controllers

Logic Controllers let you define the order of processing request in a Thread. For example, you can use Random Controllers to send HTTP requests to the server randomly.
Logic Controllers determine the order in which user request are executed.
Some commonly used Logic controllers are below:

Recording Controller:

JMeter can record your testing steps; recording controller is a place holder to store these recording steps.

Simple Controller:

Simple Controller is just a container for user request.

Loop Controller:

Loop Controller makes the user request run specified number of times or run forever as shown in figure:

Random Controller:

Random Controller makes all the user requests run in random order in each loop period.
For example, you have 3 user requests to website http://www.google.com in following order:
  1. HTTP request
  2. FTP request
  3. JDBC request
These 3 requests should run 5 times; Total 15 (5*3) user requests will be sent to Google server by JMeter.
In sequential order, requests are sent sequentially in following order:
HTTP request ->FTP request->JDBC request
for each loop.
In random order, requests are sent as randomly,
FTP request ->HTTP request->JDBC request
Or
JDBC request ->FTP request->HTTP request
For each loop.

Module Controller:

The goal of Module Controller is to add modularity to JMeter.
The general idea is that web applications consist of small units of functionality (i.e. Logon, Create Account, Logoff...). This functionality can be stored in Simple Controller as "modules".  Module Controller will choose which module needs to run.
Consider the following scenario -
You want to simulate:
  • 50 users logging out,
  • 100 users logging in
  • 30 users  search www.google.com
You can use JMeter to create 3 modules. Each module simulates each user activity: Login, Logout, and Search.
The Module controller chooses which module needs to run.

Other Important Controllers:

  • Interleave Controller:  picks up and makes one of user request run in each loop of the thread.
  • Runtime Controller: controls how long its children are allowed to run.
For example, if you specified Runtime Controller 10 seconds, JMeter will run your test for 10 seconds.
  • Transaction Controller: measures the overall time taken to finish a test execution
  • Include Controller: is designed to use an external test plan. This controller allows you to use multiple test plans in JMeter. See detail in JMeter Performance Testing.

Handons with Loop Controller

This section shows you step-by-steps instruction to add Loop Controller setting to your current performance test plan.
The Loop Controller makes the samplers run as a certain number of times, in addition to the loop value you specified for the Thread Group. For example, if you
  • Add one HTTP Request to a Loop Controller with a loop count 50
  • Configure the Thread Group loop count to 2
  • Then, JMeter will send a total of 50 * 2 = 100 HTTP Requests.
This is the roadmap of this example:

Step 1) Configuring Thread Group

We re-use the Step 1, 2 in tutorial JMeter Performance Testing.
  1. Add Thread Group

          Right click on the Test Plan and add a new thread group: Add-> Threads (Users) ->Thread Group
          But in Thread Group control panel, enter Thread Properties as following:
          It will make one user request to the web server google.com and  run it 2 times.
  1. Add JMeter elements

          Add HTTP request default to www.google.com.
  1. Adding Loop Controller

          Right Click Thread Group -> Logic Controller -> Loop Controller

Step 2) Configuring Loop Controller

Add value 50 to Loop Count field as below figure. It will make one user request to the web server google.comrun it 50 times, in addition to the loop value =2 , you specified for the Thread Group above.So JMeter will send a total of 2 * 50 = 100 HTTP Requests.
Right click Loop Controller, Add -> Sampler -> HTTP request

Step 3) Add View Results in Table

We re-use Step 2 in Timer to add View Results in Table
So the test plan is shown in below figure

Step 4) Run your test

Now return View Results in Table, click Start button on Menu bar (Ctrl+R) to run test
As shown in the figure below, JMeter simulates one user request, which is sent 100 times, to the web serverhttp://www.google.com/. The Test is stopped after user request was sent in 100 times.

Troubleshooting:

  1. If you face the issue while running the above scenario ... do the following
  2. Check whether you are connecting to internet via a proxy. If yes, remove the proxy.
  3. Open a new instance of Jmeter
  4. Open the ControllerTestPlan.jmx in Jmeter
  5. Click on Thread Group -> View Result in Table
  6. Run the Test